"When will testing be complete?" is one of the most-asked questions of a testing manager. And, just as often, the answer is given in terms of "% Complete". But what does that really mean?
Measures and Metrics
% Complete is a valuable testing metric that reports on how many of the planned tests have been executed and shows your progress versus your plan:- % Complete = (Number of tests executed) / (Number of tests planned)
Simple enough, if all you want to know is how many tests you've executed versus your plan. But it doesn't tell the whole story.
What about the quality of the product you're testing? Easy enough, that is the number of executed tests that have passed:
- % Passed = (Number of tests passed) / (Number of tests planned)
Obviously, things have not gone as well as planned if we're only meeting 67% of the requirements. There's a simple metric you can use to express the cost of poor quality.
- % Rework = ((Number of re-executed tests) / (Number of tests executed + Number of tests re-executed)
One thing % Complete, % Passed, and % Rework all have in common is that they're metrics. In other words they're calculated. And the things they are calculated from - tests planned, tests executed, tests re-executed, and test passed - are measures. In other words, they're counted. The good news is that the data for these measures and metrics should be found in your test log.
I have included a simple test execution log (available in the Toolbox in the sidebar) that automatically calculates and graphs the measures and metrics. (I have populated the log only with the information necessary to drive the calculation of metrics and measures.)
Are We There Yet?
But none of these measures and metrics directly answers the question "When will testing be complete?". This is because each measure and metric is a snapshot in time. The answer to the question can be found by graphing the measures over time to produce a trend chart that should look something like this: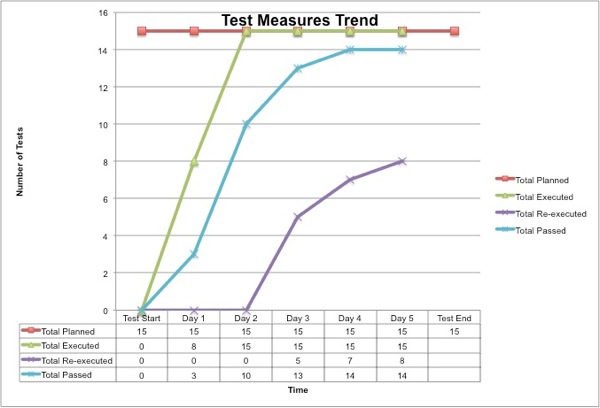
If you just go by the % Complete versus plan, testing is done on Day 2 when all tests have been executed once. But the quality of the product is less than adequate with only 67% of the requirements passing their tests. So you keep on testing. But when do you stop? The answer to that is in the "Total Passed" trend line. It should always create an S-shaped curve with the top of the curve approaching the number of tests planned. At the point the "Total Passed" S-curve levels off (Day 5 in the chart above) is when you should stop testing. At this point you should assess whether you've met your exit criteria for the testing phase, e.g., no open critical or major defects, and whether to release the product.
No comments:
Post a Comment